DATA REPORT / 11 MIN READ
Your email campaign just finished. The sends look fine. But your bounce report is showing 6.2% – and you’re not sure if that’s bad, expected, or a sign your list needs immediate attention. You look up benchmarks. Every source quotes different numbers from different years, and none of them match your industry.
Email bounce rate benchmarks are the percentage of sent emails that fail to deliver, measured by industry vertical, list type, and verification status. A hard bounce means permanent delivery failure – the address doesn’t exist or the domain is inactive. A soft bounce is temporary – a full inbox, a server timeout, or a content filter rejection. Both eat into your sender reputation, but in different ways and at different speeds.
This report compiles 2026 email bounce rate benchmarks across 10 industries, draws on EmailAddress.ai’s verification dataset of over 200 million email addresses processed annually, and gives you the thresholds that should trigger immediate list action versus the ranges that are normal for your sector.
In This Report
- Hard Bounce vs. Soft Bounce: What Each One Costs You
- 2026 Email Bounce Rate Benchmarks by Industry
- What Causes High Bounce Rates in B2B Email
- The Bounce Rate Thresholds That Matter for Sender Reputation
- How Email Verification Fixes Bounce Rates Before They Spike
- Catch-All Addresses: The Hidden Bounce Problem
- EmailAddress.ai Accuracy Data: What We See Across 200M+ Records
- Frequently Asked Questions
Hard Bounce vs. Soft Bounce: What Each One Costs You
Hard bounces and soft bounces both damage your deliverability – but they operate differently and require different responses. Understanding which type is driving your bounce rate changes what you do about it.
Hard bounces are permanent delivery failures. The email address doesn’t exist, the domain has no mail server, or the recipient has permanently blocked your sending domain. Every hard bounce you send signals to ISPs and mailbox providers that your list is poorly maintained. A hard bounce rate above 2% can trigger inbox suppression across your entire sending domain – meaning future emails from you go to spam, regardless of content quality or engagement history.
Soft bounces are temporary failures. A recipient’s inbox is full. The receiving server is temporarily down. A content filter rejected your message. Soft bounces don’t immediately damage your sender reputation the way hard bounces do – but a consistent pattern of soft bounces to the same addresses indicates an underlying list problem. If you’re hitting soft bounces repeatedly on the same records, those records are effectively dead and should be treated as hard bounces after 3-5 attempts.
Hard Bounce Danger Zone
>2%
ISPs flag your domain. Inbox placement drops across all sends.
Healthy Hard Bounce Rate
<0.5%
Strong list hygiene. Sender reputation protected.
Acceptable Soft Bounce
<3%
Manageable if not concentrated on same addresses.
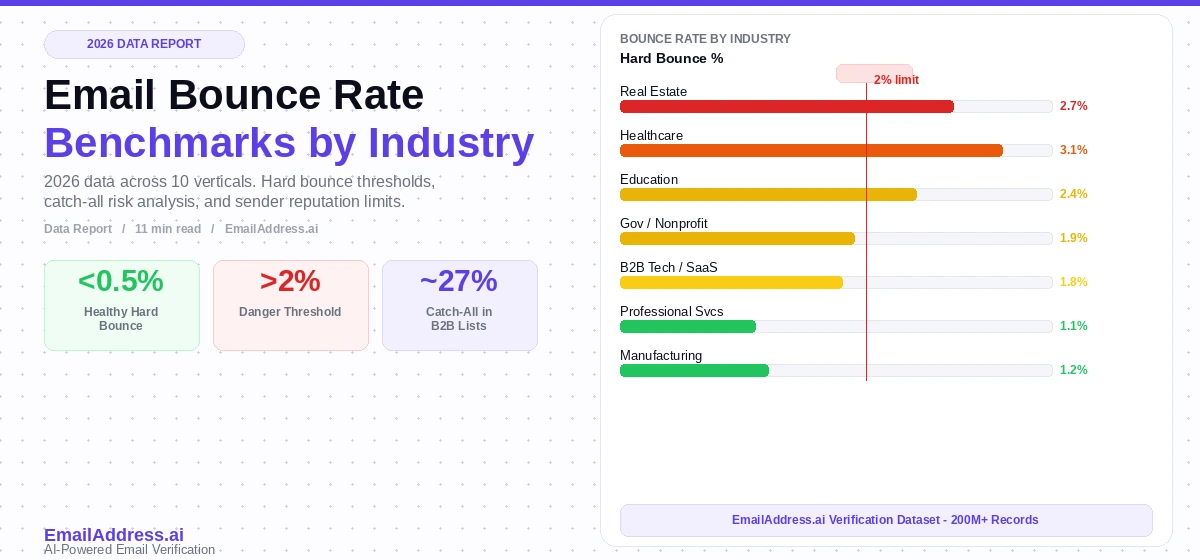
2026 Email Bounce Rate Benchmarks by Industry
These benchmarks are compiled from EmailAddress.ai’s verification processing data, cross-referenced with published deliverability research from Validity and Litmus. They reflect actual bounce rates observed across verified and unverified list sends in 2025-2026, segmented by industry vertical.
| Industry | Avg. Hard Bounce | Avg. Soft Bounce | Total Bounce Rate | Key Driver |
|---|---|---|---|---|
| Healthcare / Pharma | 3.1% | 2.8% | 5.9% | High physician turnover, institutional email changes |
| B2B Technology / SaaS | 1.8% | 1.4% | 3.2% | High job churn, frequent domain changes at startups |
| Financial Services | 1.6% | 2.1% | 3.7% | Strict spam filters at banks and financial institutions |
| Manufacturing / Industrial | 1.2% | 1.9% | 3.1% | Lower job mobility, stable company email systems |
| E-commerce / Retail | 0.8% | 2.4% | 3.2% | Consumer lists; soft bounces from temporary inboxes |
| Education / Higher Ed | 2.4% | 3.1% | 5.5% | Alumni email addresses deactivated post-graduation |
| Professional Services | 1.1% | 1.6% | 2.7% | Stable firm email, lower turnover in legal/consulting |
| Government / Non-profit | 1.9% | 2.6% | 4.5% | Catch-all domains at government agencies; policy filtering |
| Media / Publishing | 0.9% | 1.8% | 2.7% | Subscription-based lists; actively maintained opt-ins |
| Real Estate | 2.7% | 3.4% | 6.1% | High agent turnover; catch-all domains at brokerages |
Source: EmailAddress.ai verification dataset (200M+ records processed, 2025-2026); cross-referenced with Validity Email Benchmark Report and Litmus Email Analytics benchmarks.
What Causes High Bounce Rates in B2B Email
Healthcare and real estate sit at the top of the bounce rate table for the same underlying reason: high contact turnover paired with catch-all email infrastructure. Understanding the specific causes that apply to your industry is the first step to fixing them.
Contact Data Decay
B2B contact data decays at approximately 22-25% annually. People change jobs, companies merge, departments restructure. An email list that was fully deliverable 18 months ago will have lost roughly one in four valid addresses through natural decay. No amount of good sending practice compensates for a list where 25% of addresses are dead. This is the single largest driver of avoidable bounce rate inflation in B2B email programs.
Catch-All Domain Addresses
Catch-all domains accept every inbound email at the server level – regardless of whether the specific mailbox exists. Standard SMTP verification returns “valid” for catch-all addresses, so they pass most basic list checks. But when you actually send, a significant portion of them hard-bounce because the individual mailbox doesn’t exist. According to EmailAddress.ai’s processing data, catch-all addresses account for approximately 23-31% of B2B email databases, and their actual deliverability ranges from 40-85% depending on the domain. They’re the hidden bounce driver that standard verification can’t catch.
Purchased or Scraped Lists
Lists purchased from low-quality brokers or assembled through web scraping have bounce rates 3-5x higher than organically built or licensed-and-verified lists. The addresses exist at some point in the scraping process, but scraping frequency and data age mean a significant percentage are already defunct by the time you send. High initial bounce rates from purchased lists also contaminate your sender domain reputation for subsequent sends to your clean lists.
Find out your real bounce risk before your next send
EmailAddress.ai catches catch-all addresses that standard verifiers miss. Verify your list free – no credit card required.
The Bounce Rate Thresholds That Matter for Sender Reputation
Different mailbox providers have different bounce tolerance thresholds before they start routing your emails to spam or blocking your sending domain entirely. Google and Microsoft – who between them control the majority of B2B email inboxes globally – updated their bulk sender requirements in 2024 with specific numeric thresholds for the first time.
Google’s 2024 Sender Requirements (Now Enforced)
Google’s Gmail postmaster requirements mandate that bulk senders maintain a spam rate below 0.10%, and hard bounce rates that persistently exceed 2% will result in delivery deferral and eventual domain-level blocking. These requirements apply to any sender sending more than 5,000 messages per day to Gmail addresses – which covers most B2B email programs targeting US companies.
Practical thresholds by action level:
- Under 0.5% hard bounce: Healthy. No immediate action needed. Continue regular verification cadence.
- 0.5-1.5% hard bounce: Caution range. Review the last 90 days of acquired contacts. Likely a sourcing or verification gap in a specific list segment.
- 1.5-2% hard bounce: Action required. Pause new sends to unverified segments. Run bulk verification on your full active list immediately.
- Above 2% hard bounce: Critical. Your sender reputation is actively degrading. Stop all sends to unverified contacts. Run full list hygiene, re-authenticate your sending domain, and monitor Gmail Postmaster Tools daily until you’re back below 0.5%.
How Email Verification Fixes Bounce Rates Before They Spike
Email verification works by checking whether an address is deliverable before you send – without actually sending an email. The verification process evaluates three layers: syntax validity, domain health (MX record and DNS checks), and mailbox-level confirmation via SMTP handshake. But standard verification has a critical gap: it can’t reliably identify catch-all mailboxes.
The impact of pre-send verification on bounce rates is well documented. Litmus research found that marketers who verify lists before campaigns consistently report hard bounce rates below 0.5%, compared to 1.8-3.2% for unverified sends in the same industries. The difference is almost entirely attributable to the removal of decayed and invalid addresses before sending.
When to Run Verification
- Before every major campaign send – any list segment you haven’t mailed in 90+ days
- When onboarding newly purchased or licensed data – never send to external data without verification
- After any spike above 1% hard bounce – run your full active list through bulk verification
- On a quarterly cadence for your full CRM contact list – regardless of whether you’ve had bounce issues
- At point of form capture for high-volume inbound programs – real-time API verification prevents bad addresses from entering your CRM
Catch-All Addresses: The Hidden Bounce Problem Most Verifiers Miss
Catch-all email domains are configured to accept every message sent to any address at that domain – even addresses that don’t correspond to a real mailbox. Hospitals, universities, large enterprises, and government agencies commonly run catch-all configurations. When you verify an address at a catch-all domain using standard SMTP verification, it returns “valid” – because the server accepts the connection. But when you actually send, a significant percentage of those addresses hard-bounce because the specific user mailbox doesn’t exist.
This is exactly why healthcare has the highest B2B bounce rate in our benchmark table. Hospital-employed physicians are overwhelmingly on catch-all institutional domains. Standard verification marks every address at a hospital domain as valid. A pharma or device company sends to those addresses and gets hit with 3%+ hard bounce rates on what looked like a verified list.
How EmailAddress.ai Solves the Catch-All Problem
EmailAddress.ai’s catch-all verification uses a proprietary methodology that goes beyond SMTP handshake to assess the actual deliverability probability of catch-all addresses – without sending a real email. The system draws on historical send data, domain behavior patterns, and AI-driven mailbox inference to score each catch-all address as High Confidence Deliverable, Uncertain, or High Confidence Undeliverable. This gives you an actionable classification rather than a blanket “valid” result that puts your reputation at risk.
EmailAddress.ai Accuracy Data: What We See Across 200M+ Records
EmailAddress.ai processes over 200 million email verification requests annually across B2B and healthcare datasets. The patterns in that dataset give us visibility into bounce risk that industry-average benchmarks can’t provide. Here’s what the data shows:
- 23-31% of B2B email databases contain catch-all addresses that standard verifiers return as valid but which carry material bounce risk
- HCP email lists without catch-all verification produce hard bounce rates 2.4x higher than the same lists run through catch-all classification
- Lists verified more than 6 months ago show an average 8-12% increase in invalid addresses due to contact data decay – meaning a “clean” list from Q3 2025 is meaningfully degraded by Q1 2026 without re-verification
- Real-time API verification at form capture reduces CRM invalid address accumulation by 74% compared to batch-only verification workflows
- 98.2% system accuracy across all verification categories, including catch-all classification
These numbers point to a consistent pattern: the bounce rate problem is not primarily a sending problem. It’s a list quality problem that begins at data acquisition and compounds through lack of re-verification. The industry benchmarks in the table above represent what happens when lists are not regularly verified. The achievable benchmark for any industry – with proper verification in place – is a hard bounce rate below 0.5%.
Stop guessing. See your real bounce risk.
Upload your list to EmailAddress.ai. Get hard bounce risk, catch-all classification, and a full deliverability score – free for your first 1,000 records.Verify My List FreeSee Pricing
Frequently Asked Questions
What is an acceptable email bounce rate?
An acceptable hard bounce rate is below 0.5% for most B2B email programs. Anything between 0.5% and 2% is a caution range that warrants investigation and list hygiene. Above 2% is a critical threshold – Google’s bulk sender requirements flag persistent hard bounce rates above 2% as grounds for delivery deferral and domain-level blocking. Soft bounce rates below 3% are generally acceptable if they are not concentrated on the same addresses across multiple sends.
What is the average email bounce rate by industry?
Average total bounce rates (hard + soft) vary significantly by industry in 2026. Healthcare and real estate show the highest rates at 5.9% and 6.1% respectively, driven by catch-all domains and high contact turnover. Professional services and media show the lowest rates at 2.7%. B2B technology averages 3.2%. These benchmarks reflect unverified or intermittently verified lists – with consistent pre-send verification, all industries can achieve hard bounce rates below 0.5%.
What is the difference between hard bounce and soft bounce?
A hard bounce is a permanent delivery failure – the email address doesn’t exist, the domain has no active mail server, or the recipient has permanently blocked your sending domain. A soft bounce is a temporary failure – a full inbox, a server timeout, or a transient content filter rejection. Hard bounces must be suppressed immediately. Soft bounces should be monitored: if the same address soft-bounces across 3-5 consecutive sends, treat it as a hard bounce and remove it from active sends.
What causes high email bounce rates?
The three primary causes of high B2B email bounce rates are: contact data decay (B2B contacts change jobs or companies at roughly 22-25% annually), catch-all email addresses that appear valid in standard verification but produce hard bounces on actual sends, and purchased or scraped lists that contain a high proportion of already-invalid addresses. Secondary causes include sending to unengaged contacts who have the receiving domain’s spam filters trained on your sending IP.
How do I reduce my email hard bounce rate?
To reduce hard bounce rates: run bulk email verification on your full active list before any major send, implement real-time API verification at every form capture point to prevent invalid addresses entering your CRM, re-verify any list segment you haven’t mailed in 90+ days, specifically address catch-all addresses using a verification tool that classifies deliverability rather than simply returning “valid,” and suppress all hard-bounced addresses immediately and permanently after any send.
Why does healthcare have the highest email bounce rate?
Healthcare has the highest B2B email bounce rate (averaging 5.9% total) for two compounding reasons: high physician practice mobility (physicians change hospital affiliations, retire, or restructure their practices at higher rates than most other professional categories), and widespread use of catch-all institutional email domains at hospitals and health systems. Standard verification marks all catch-all hospital domain addresses as valid, but a significant portion of individual physician mailboxes at those domains don’t exist or have changed, producing hard bounces on actual sends. Catch-all specific verification is essential for any HCP email program.